
INTRODUCTION
The built-in Kubernetes Horizontal Pod Autoscaler (HPA) scales the Pods using CPU and Memory metrics according to the defined threshold. However, in cases where an engineer needs to design a custom metric, such as triggering Pod scaling based on an HTTP traffic metric, the KEDA function can be employed.
KEDA is a Kubernetes-based Event Driven Autoscaler. With KEDA, you can drive the scaling of any container in Kubernetes based on the number of events needing to be processed.
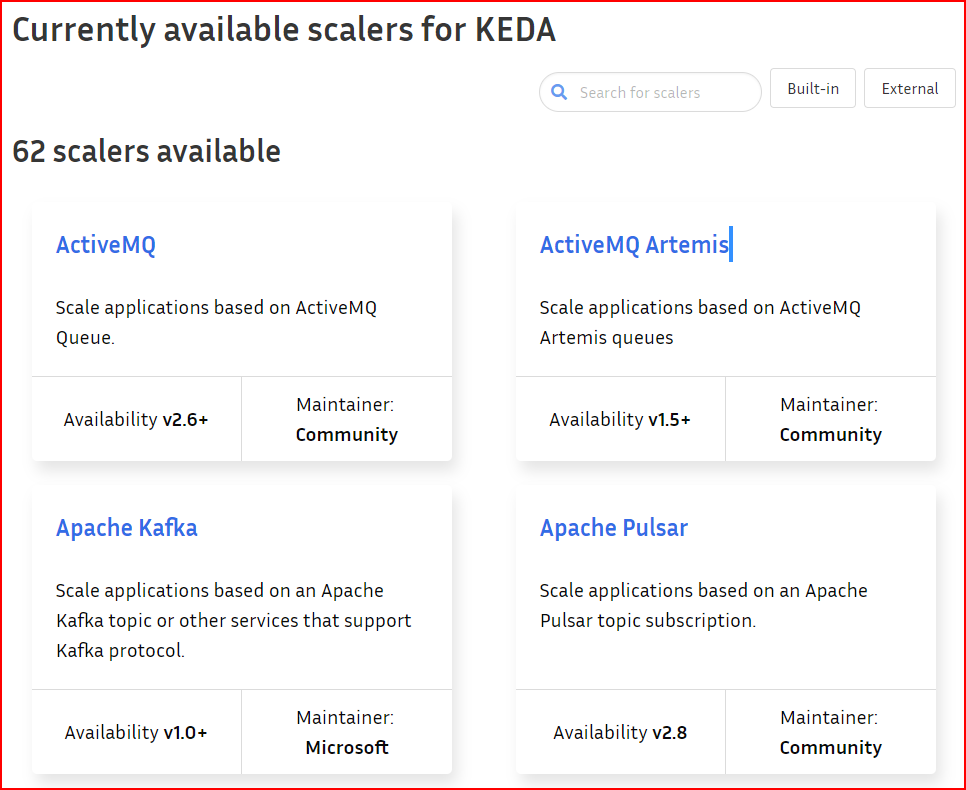
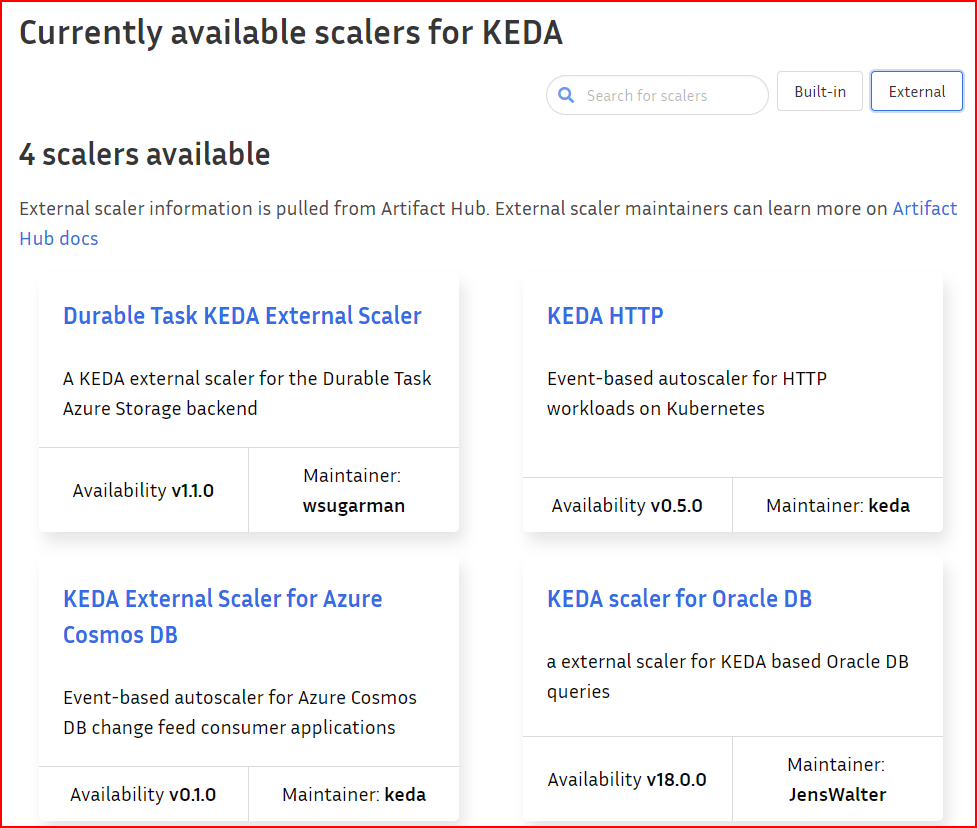
KEDA offers a wide range of scalers to facilitate horizontal scaling of Pods. Presently, KEDA provides access to 62 built-in scalers and 4 external scalers, as detailed in the documentation available at https://keda.sh/docs/2.11/scalers/.
In this scenario, our aim is to horizontally scale the Pods on Kubernetes in response to an increase in HTTP traffic directed towards them. Let’s explore how we can accomplish this objective.
PREREQUISITE
- Assumed you have Kubernetes cluster spawn by the RKE2 engine
- Kubectl and Helm 3 packages are already installed on the local machine
- Kubectl and Helm are configured to access the K8s cluster
STEPS
Deploy KEDA to RKE2 K8s Cluster
Deploying KEDA into your Kubernetes (K8s) Cluster involves three steps. However, the writer has opted for the easier method of deploying KEDA using Helm charts. Please follow the subsequent steps to install KEDA on your K8s cluster.
- Add Helm Repo
helm repo add kedacore https://kedacore.github.io/charts- Update Helm repo
helm repo update- Install
KEDAHelm chart- Helm 3
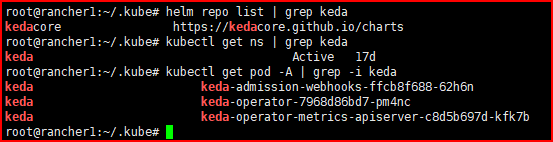
kubectl create namespace keda
helm install keda kedacore/keda --namespace keda
more on Deploying KEDA
Adding Required Configs and Annotations to Ingress Controller
We need HTTP ingress traffic captured by Prometheus as the scaler trigger to the Pods Autoscaling. Thus, we must first add some configurations to the default ingress provided by RKE2.
Add new helmconfig configuration to an existing rancher ingress controller, so that the Prometheus is aware of the Ingress controller targets. You can refer to the following article on how to add configuration to an existing helm config on the K8s cluster Enable ModSec WAF On RKE2 Ingress
apiVersion: helm.cattle.io/v1
kind: HelmChartConfig
metadata:
name: rke2-ingress-nginx
namespace: kube-system
spec:
valuesContent: |-
controller:
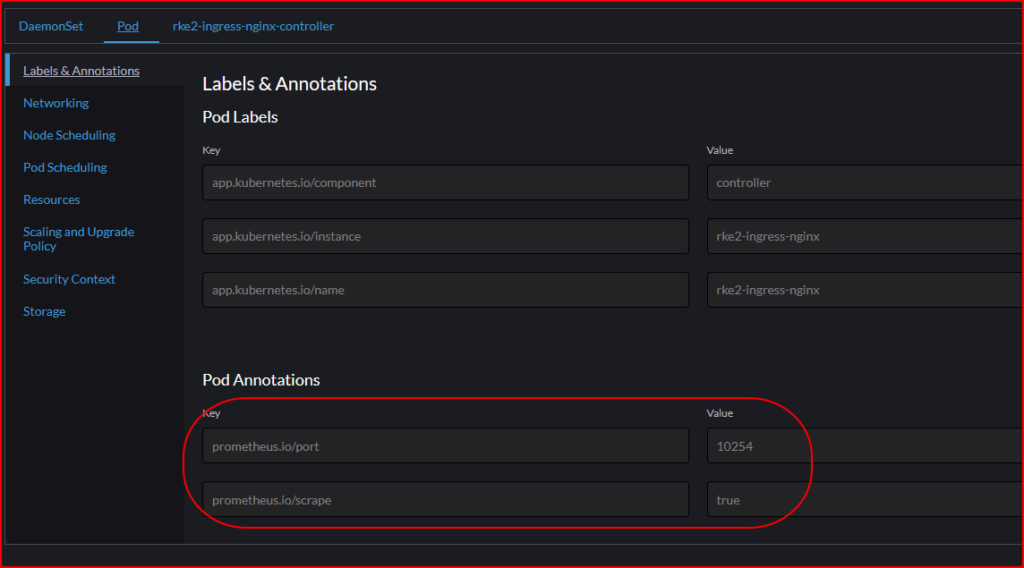
podAnnotations:
prometheus.io/scrape: "true"
prometheus.io/port: "10254"
config:
use-forwarder-headers: true
enable-prometheus-metrics: true # Enable the metrics to be sent to the Prometheus
enable-latency-metrics: true
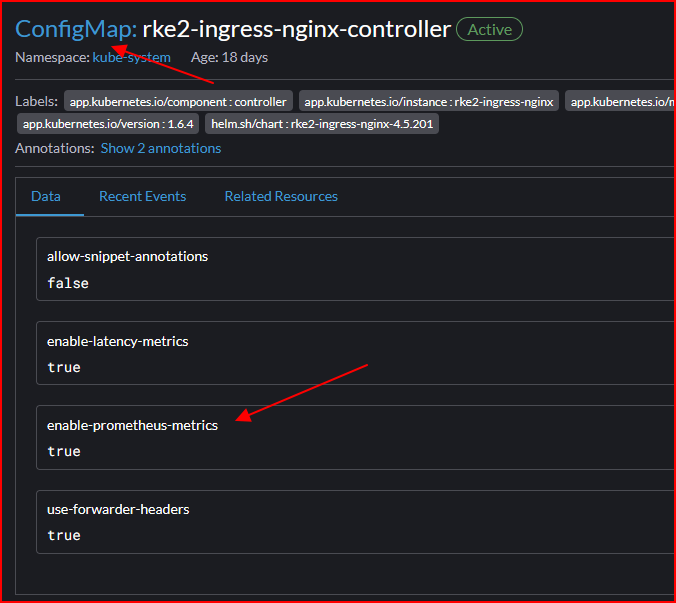
Apply the helm chart config above using a kubectl command:
kubectl apply -f /path/to/the/helmchartconfig.yaml
The final result of the Ingress Controller DaemonSet and the ConfigMap will look like the following pictures.
Deploy Prometheus to The K8s Cluster
Download the Prometheus kustomization manifest on this repository https://github.com/kubernetes/ingress-nginx.
The manifest files should be inside deploy/prometheus directory.
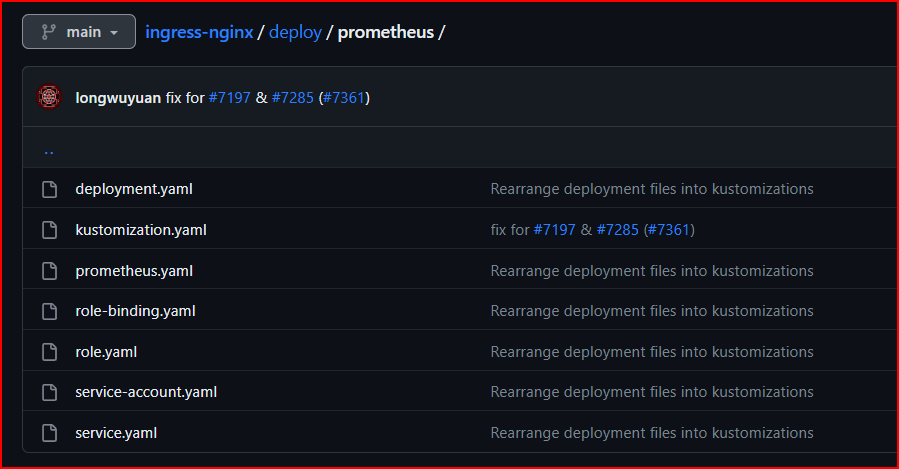
Edit the kustomization.yaml file to the correct value of your K8s ingress namespace and labels:
apiVersion: kustomize.config.k8s.io/v1beta1
kind: Kustomization
namespace: kube-system ## Edit this to the correct value, may differ according to how your Ingress Controller is deployed ##
commonLabels:
  app.kubernetes.io/name: prometheus
  app.kubernetes.io/part-of: kube-system ## Edit this to the correct value, may differ according to how your Ingress Controller is deployed ##
resources:
- role.yaml
- service-account.yaml
- role-binding.yaml
- deployment.yaml
- service.yaml
images:
- name: prom/prometheus
configMapGenerator:
- name: prometheus-configuration
  files:
  - prometheus.yaml
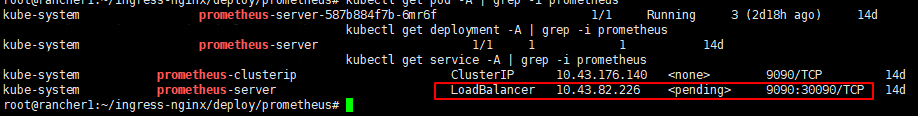
Next, please also edit the Prometheus service to be exposed from outside the cluster.
e.g.
apiVersion: v1
kind: Service
metadata:
  name: prometheus-server
spec:
  type: LoadBalancer
  ports:
    - port: 9090
      targetPort: 9090
      nodePort: 30090 ## Adjust the public port to your liking ##
Lastly, navigate to where your Prometheus kustomization file resided and apply the config by executing the command below:
kubectl apply --kustomize .
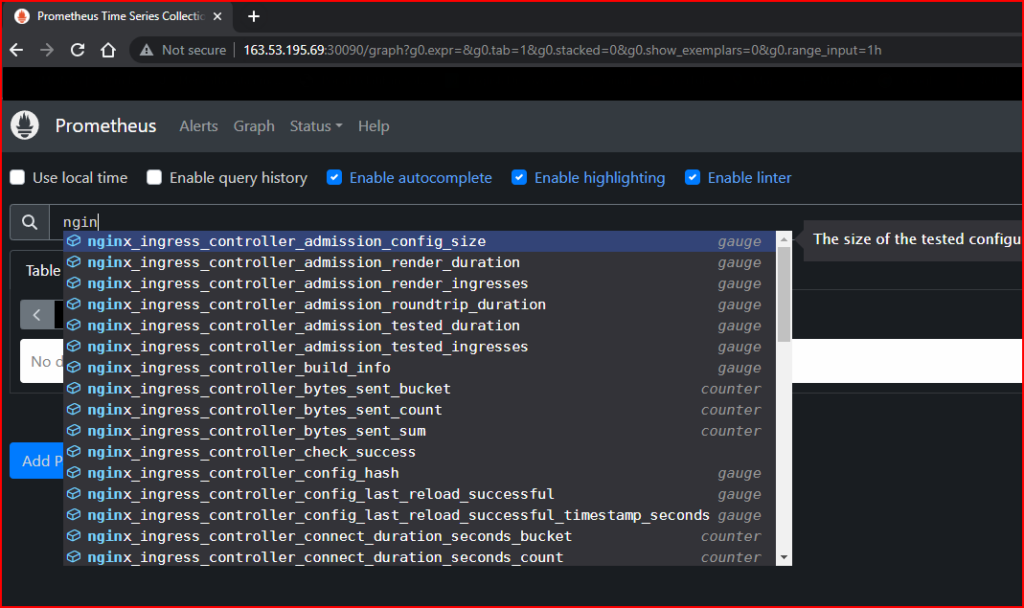
Open your browser and visit your Prometheus URL http://<your public IP>:<your public port>.
According to the example above, the URL will be http://163.53.195.69:30090/
Creating Workload for Testing
In this section, we will create WordPress deployment and statefulset manifests that will be used as scaling objects of our HPA.
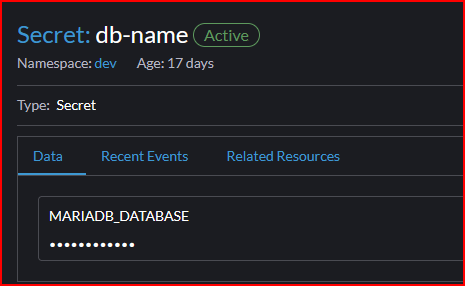
Create a secret for the database name and the root password. Optionally you can modify the database statefulset manifest and pass the image to allow MYSQSL_ROOT_EMPTY_PASSWORD
Create persistence volume and persistence volume claim like an example below.
persistence volume


persistence volume claim
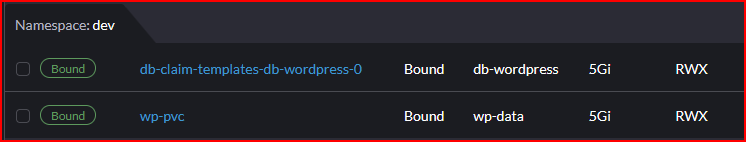
NOTE: The database provisioned by Statefulset will automatically create a volume claim template for the available persistence volume.
db-wordpress.yaml
apiVersion: apps/v1
kind: StatefulSet
metadata:
  labels:
    workload.user.cattle.io/workloadselector: apps.statefulset-dev-db-wordpress
  name: db-wordpress
  namespace: dev
spec:
  replicas: 1
  selector:
    matchLabels:
      workload.user.cattle.io/workloadselector: apps.statefulset-dev-db-wordpress
  serviceName: db-headless
  template:
    metadata:
      labels:
        workload.user.cattle.io/workloadselector: apps.statefulset-dev-db-wordpress
      namespace: dev
    spec:
      containers:
        - env:
            - name: MARIADB_DATABASE
              valueFrom:
                secretKeyRef:
                  key: MARIADB_DATABASE
                  name: db-name
                  optional: false
            - name: MARIADB_ROOT_PASSWORD
              valueFrom:
                secretKeyRef:
                  key: MARIADB_ROOT_PASSWORD
                  name: root-password
                  optional: false
          image: mariadb:latest
          imagePullPolicy: Always
          name: db-wordpress
          ports:
            - containerPort: 3306
              name: db-svc
              protocol: TCP
          volumeMounts:
            - mountPath: /var/lib/mysql
              name: db-claim-templates
      terminationGracePeriodSeconds: 30
  volumeClaimTemplates:
    - apiVersion: v1
      kind: PersistentVolumeClaim
      metadata:
        name: db-claim-templates
        namespace: dev
      spec:
        accessModes:
          - ReadWriteMany
        resources:
          requests:
            storage: 5Gi
        storageClassName: ''
        volumeMode: Filesystem
        volumeName: db-wordpress
wordpress.yaml
apiVersion: apps/v1
kind: Deployment
metadata:
  labels:
    workload.user.cattle.io/workloadselector: apps.deployment-dev-wordpress
  name: wordpress
  namespace: dev
spec:
  progressDeadlineSeconds: 600
  replicas: 1
  revisionHistoryLimit: 10
  selector:
    matchLabels:
      workload.user.cattle.io/workloadselector: apps.deployment-dev-wordpress
  strategy:
    rollingUpdate:
      maxSurge: 25%
      maxUnavailable: 25%
    type: RollingUpdate
  template:
    metadata:
      creationTimestamp: null
      labels:
        workload.user.cattle.io/workloadselector: apps.deployment-dev-wordpress
      namespace: dev
    spec:
      containers:
        - env:
            - name: WORDPRESS_DB_HOST
              value: db-wordpress
            - name: WORDPRESS_DB_USER
              value: root
            - name: WORDPRESS_DB_PASSWORD
              valueFrom:
                secretKeyRef:
                  key: MARIADB_ROOT_PASSWORD
                  name: root-password
                  optional: false
            - name: WORDPRESS_DB_NAME
              valueFrom:
                secretKeyRef:
                  key: MARIADB_DATABASE
                  name: db-name
                  optional: false
          image: wordpress:latest
          imagePullPolicy: Always
          name: wordpress
          ports:
            - containerPort: 80
              name: wordpress-svc
              protocol: TCP
          resources:
            limits:
              cpu: 100m
              memory: 200Mi
          volumeMounts:
            - mountPath: /var/www/html
              name: vol-wordpress
      restartPolicy: Always
      terminationGracePeriodSeconds: 30
      volumes:
        - name: vol-wordpress
          persistentVolumeClaim:
            claimName: wp-pvc
wordpress-svc.yaml
apiVersion: v1
kind: Service
metadata:
  annotations:
    field.cattle.io/targetWorkloadIds: '["dev/wordpress"]'
  name: wordpress
  namespace: dev
spec:
  ports:
    - name: wordpress-svc
      port: 80
      protocol: TCP
      targetPort: 80
  selector:
    workload.user.cattle.io/workloadselector: apps.deployment-dev-wordpress
  type: ClusterIP
db-wordpress-svc.yaml
apiVersion: v1
kind: Service
metadata:
  annotations:
    field.cattle.io/targetWorkloadIds: '["dev/db-wordpress"]'
  name: db-wordpress
  namespace: dev
spec:
  ports:
    - name: db-svc
      port: 3306
      protocol: TCP
      targetPort: 3306
  selector:
    workload.user.cattle.io/workloadselector: apps.statefulset-dev-db-wordpress
  type: ClusterIP
wp-ingress.yaml
apiVersion: networking.k8s.io/v1
kind: Ingress
metadata:
  name: wp-ingress
  namespace: dev
spec:
  rules:
    - host: wp.mamadngelinux.my.id
      http:
        paths:
          - backend:
              service:
                name: wordpress
                port:
                  number: 80
            path: /
            pathType: Prefix
Writing ScaledObject Manifest based On Prometheus Metric
It’s time to write the KEDA ScaledObject based on the access frequency pulled from the Prometheus metric.
apiVersion: keda.sh/v1alpha1
kind: ScaledObject
metadata:
  name: wordpress-scale
  namespace: dev
  labels:
        deploymentName: wordpress
spec:
    scaleTargetRef:
        kind: Deployment
        name: wordpress

    pollingInterval: 15
    cooldownPeriod:  30
    minReplicaCount: 1
    maxReplicaCount: 10
    triggers:
    - type: prometheus
      metadata:
        serverAddress: http://163.53.195.69:30090
        metricName: access_frequency
        threshold: '1'
query: sum(rate(nginx_ingress_controller_requests[1m]))deploymentNameis the name of the function app DeploymentpollingIntervalis how frequently in seconds KEDA does poll PrometheusminReplicaCountis how many minimal replicas are applied to the deploymentmaxReplicaCountis how many maximum replicas are applied to the deploymentqueryis pointing to the Prometheus query which tracks the metrics of incoming requests to the ingress controller at the last minute. Since thethresholdis ‘1’ the function app will scale as long as the number of requests/minute > 60

Load Testing
Once the ScaledObject has been applied to the Deployment of the application, the next step is to conduct load testing to verify the proper functioning of the scaling mechanism.
We use this tool to generate HTTP load testing against the desired URL https://github.com/nakabonne/ali
Paste the example command below to start the load testing
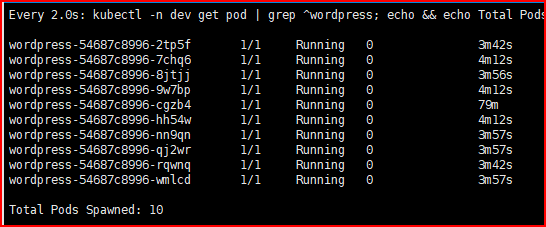
ali --rate=500 --duration=2m http://wp.mamadngelinux.my.idWordPress Pod before the load testing is started
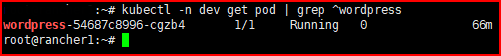
WordPress Pod after the load testing is executed
CONCLUSION
Deploying KEDA on your Kubernetes cluster enables the creation of custom Horizontal Pod Autoscalers (HPA). By leveraging the scalers offered by KEDA, it becomes possible to automatically scale Kubernetes Pods based on the desired trigger. In this article, we have effectively showcased the process of scaling based on HTTP metrics extracted from Prometheus.
Leave a Reply